Dashboard 🖥
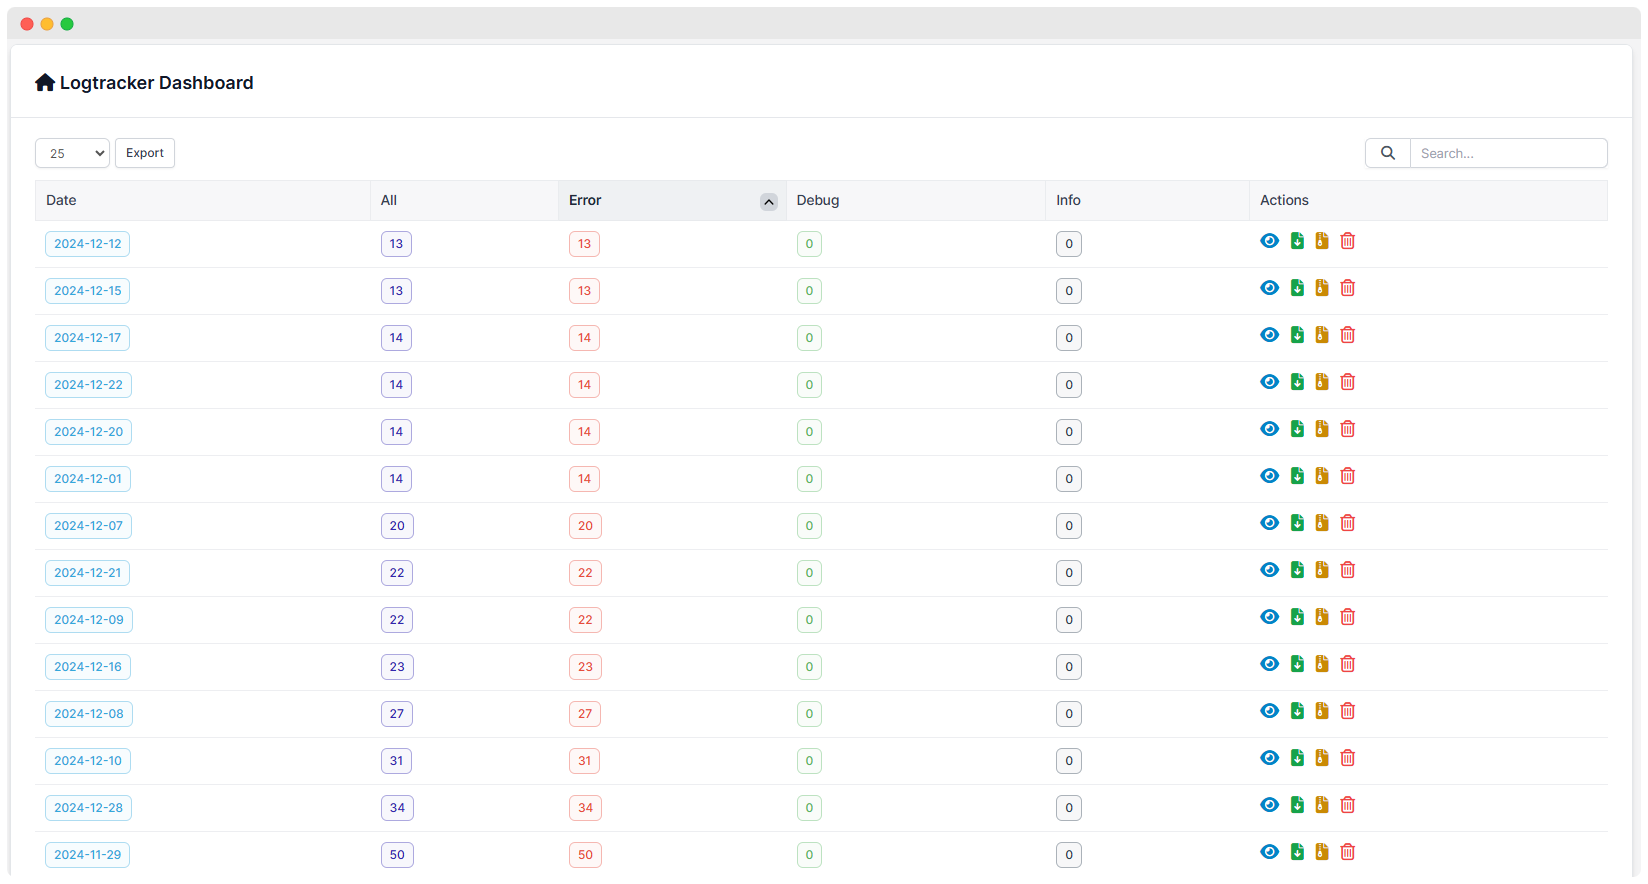
The Logtracker Dashboard provides an overview of error logs for a given period of time. It displays the number of errors categorized as Error, Debug, and Info along with the total number of logs.
Filters and Export
- At the top, a dropdown allows users to filter the number of entries displayed per page (e.g., 25).
- There is an "Export" button, likely used to download the log data (e.g., CSV, Excel).
Data Columns
- Date: The date indicates when the logs were recorded.
- All: You can see all number of logs for the selected date.
- Error: You can see on which date Number of errors categorized as "Error"
- Debug: You can see the number of debug logs for that date.
- Info: You can see the number of info logs for that date.
- Action:
- You can view the information of log errors,info,debug,path etc. 👁🗨
- You can download error as document file by clik on document button.it downloads file of specific date📄
- You can download error as zip by click on zip button.it downloads zip file of specific date📁🗜
- You can delete the error log file by click on delete button.it delete file error of specific date 🗑
Log details
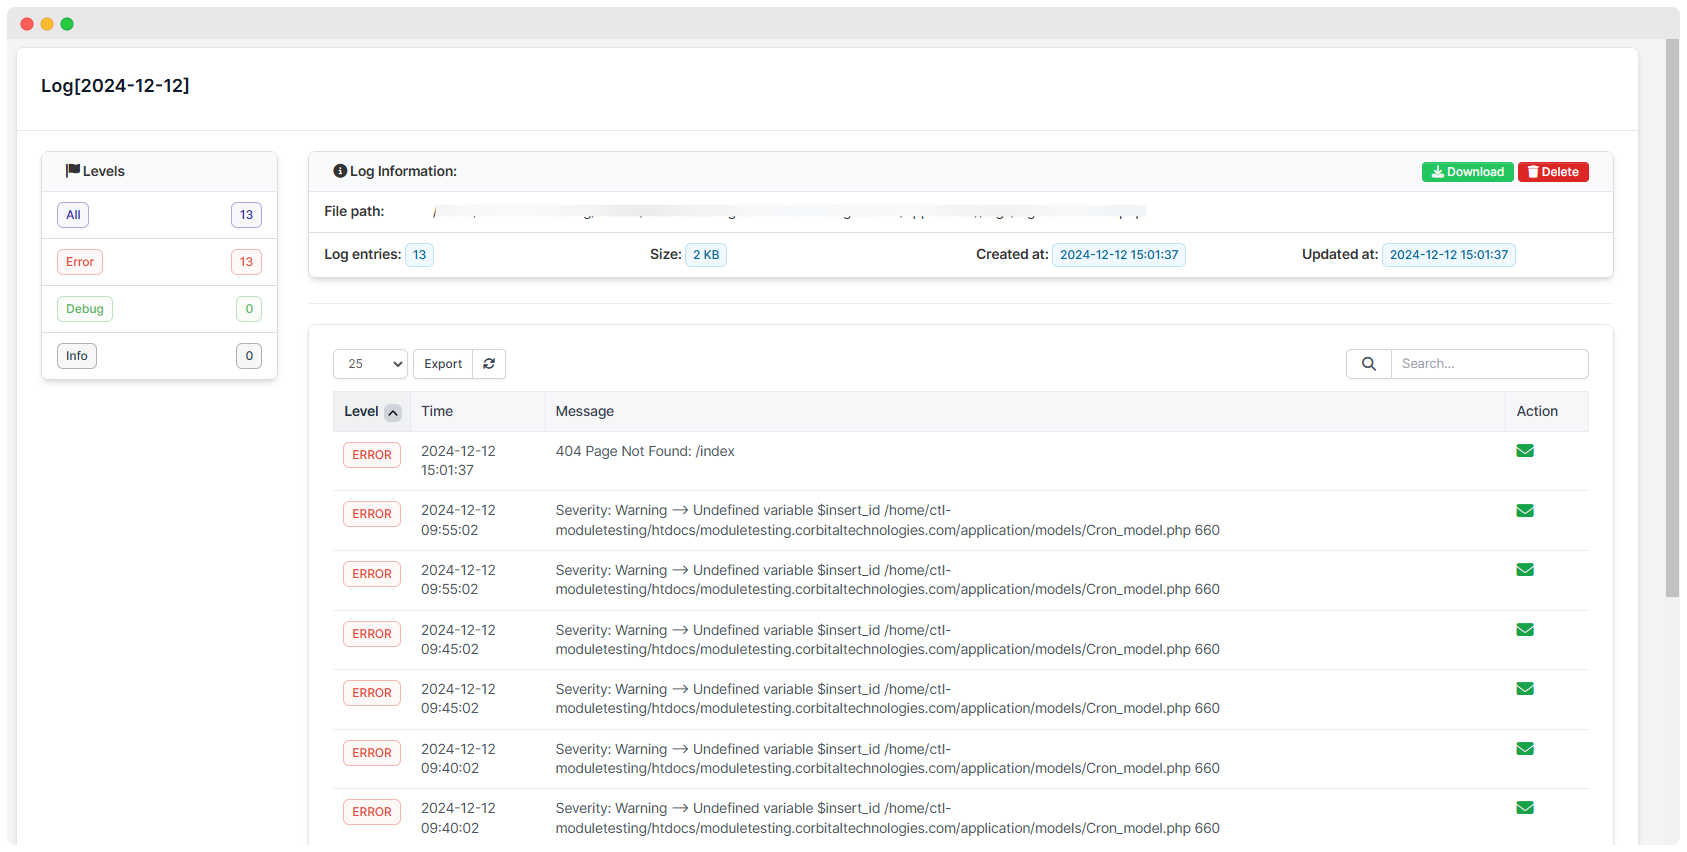
Sidebar (Log Levels):
The left-hand panel categorizes logs into different levels
1.All, Error, Debug, Info:
- Each category shows a count of logs for easy navigation. For example:
- These buttons allow you to filter logs by severity level.
- For example, selecting "Error" displays only error logs, as seen in the main table.
2.Log Information:
Displays metadata about the log file at the top, such as
File path: File path displays the location of the log file being analyzed.
Log Entries: It displays the total number of log entries.
Size: It displays the file size of the log.
Created at and Updated at timestamps.displays when log is created and when it was updated.
Download: You can download the log file for offline inspection.
Delete: You can delete the log file from the system to save space or remove irrelevant data.
3.Table View of Logs:
Each log entry is displayed in a table with columns:
Level: It Indicates the log type (e.g., ERROR).
Time: It displays the timestamp of the log.
Title: It displays a brief summary of the log (e.g., "Page Not Found: Index").
Message: It displays detailed information about the log (e.g., stack trace, warnings, or errors).
Action: You can send email to developers by click on email button for error
4.Search:
Options to filter logs based on severity (Levels) or use the search bar to find specific log entries.
Action
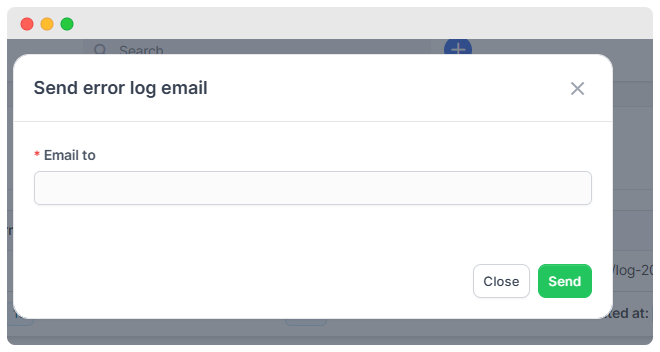
- Send Emails
- You can send error for error log or error message to specific developer or admin easily