System Logs in WhatsMark
WhatsMark offers a comprehensive Log Viewer that provides real-time insight into your application’s health and behavior. Whether you're debugging, tracking failed requests, or analyzing system changes, this module ensures detailed log visibility for developers and admins.
Key Features
Severity-Based Filters
WhatsMark categorizes logs using Laravel’s built-in logging levels. Each level represents the severity and purpose of the log entry:
| Level | Description |
|---|---|
| Emergency | System is unusable. Requires immediate attention. Example: “Server crashed and cannot restart.” |
| Alert | Action must be taken immediately. Example: “Database connection dropped unexpectedly.” |
| Critical | Critical conditions that threaten core functionality. Example: “Failed to load payment gateway keys.” |
| Error | Runtime errors that should be investigated but don’t halt the system. Example: “Webhook timeout” or “API failed to respond.” |
| Warning | Something unexpected occurred but the system continues to function. Example: “Deprecated config used.” |
| Notice | Normal but significant events. ℹ Example: “New admin user created.” |
| Info | Informational messages for general application events. Example: “User logged in successfully.” |
| Debug | Detailed debug information for developers during testing. Example: “Variable $user contains null.” |
| Local | Custom tag to show logs relevant only to local/development environments. Example: “Testing mode active.” |
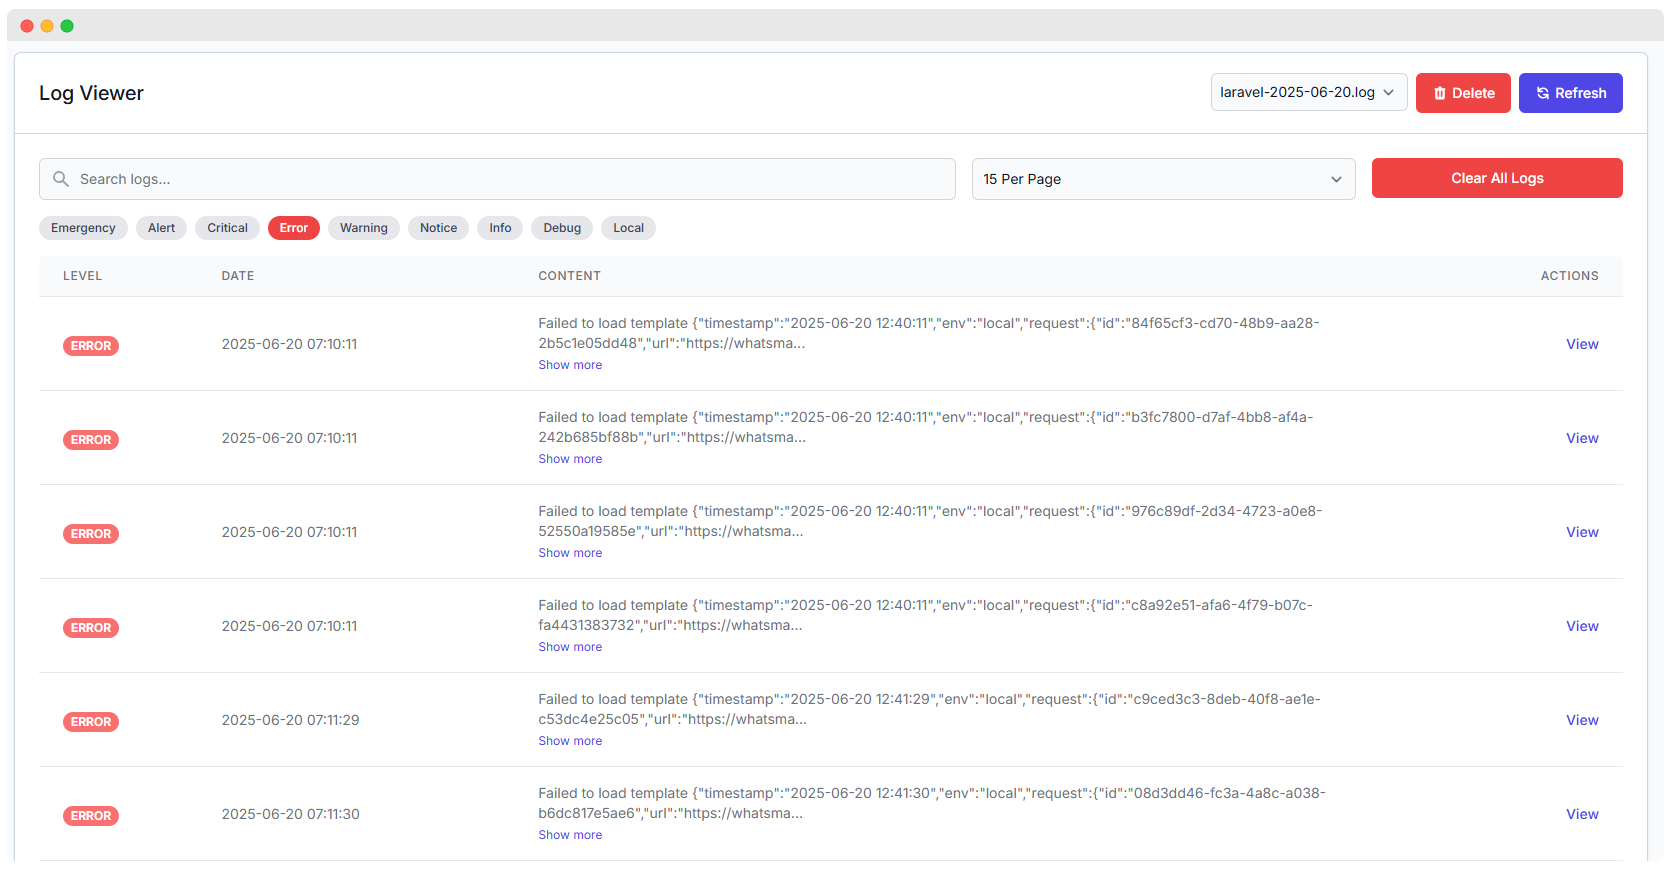
Log Entries Overview
WhatsMark presents logs in a user-friendly, paginated table with the following structure:
| Field | Description |
|---|---|
| Level | Severity classification (e.g. ERROR, DEBUG, INFO). |
| Date & Time | Timestamp of when the log was generated (e.g., 2025-06-20 07:10:11). |
| Content | Brief description or a truncated JSON message of the error or system message. |
| Actions | A View button to examine complete log details in a modal window. |
| Pagination | Select how many entries to display per page (e.g., 15 Per Page). |
View Log Entry Details
When clicking on the View button, a modal displays detailed content from the selected log.
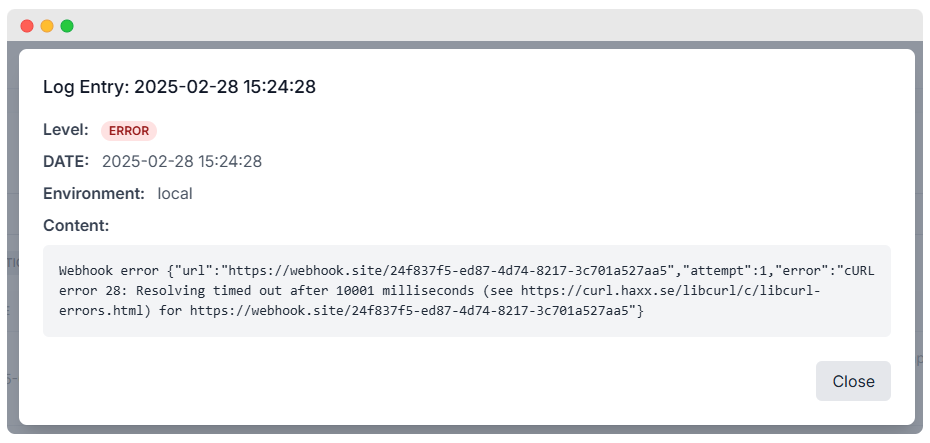
Example Log Entry
Log Entry: 2025-02-28 15:24:28Level: ERROREnvironment: local
This type of error usually indicates a network timeout or DNS resolution failure during a webhook/API call.
Log File Management Options
Manage and maintain your logs effectively with the following actions:
- Refresh – Updates the view to show the latest entries.
- Delete – Deletes the selected log file (use with caution).
- Clear All Logs – Erases all logs in one action for cleanup and space recovery.
- Log File Selector – Switch between logs using the dropdown (e.g.,
laravel-2025-06-20.log).
Common Log Issues and Descriptions
| Issue Type | Description |
|---|---|
| Webhook Timeout | Occurs when external APIs or webhooks fail to respond within the allowed time. |
| Template Errors | Happens when message templates fail to render properly. |
| Config Errors | Usually due to missing or outdated config cache. |
| Route Not Found | Indicates missing or invalid endpoint usage. |
Log Actions Explained
Each log entry listed in the log viewer provides an "Actions" column where you can perform detailed operations:
View
- Clicking the View button opens a modal window showing the full log entry.
- It includes:
- Timestamp
- Log Level (e.g., ERROR, WARNING)
- Environment (e.g.,
local,production) - Full content of the log (API response, webhook error, exception stack, etc.)
- This feature is especially useful for debugging failed webhooks, API timeouts, or template rendering issues.
Why the View Action Matters
- Helps identify root causes of recurring issues.
- Enables quick inspection without needing to open log files manually.
- Works with filters (Error, Warning, Info, Debug) for efficient troubleshooting.
Use the "View" action consistently when:
- You need full tracebacks for Laravel exceptions.
- A webhook or cron job is silently failing.
- Logs appear frequently for the same event (indicating a systemic error).