Admin Dashboard
The Admin Dashboard is the operational headquarters of your WhatsApp Marketing SaaS business. This single interface gives the admin real-time access to all platform activity, KPIs, and financial insights.
Dashboard Interface Preview
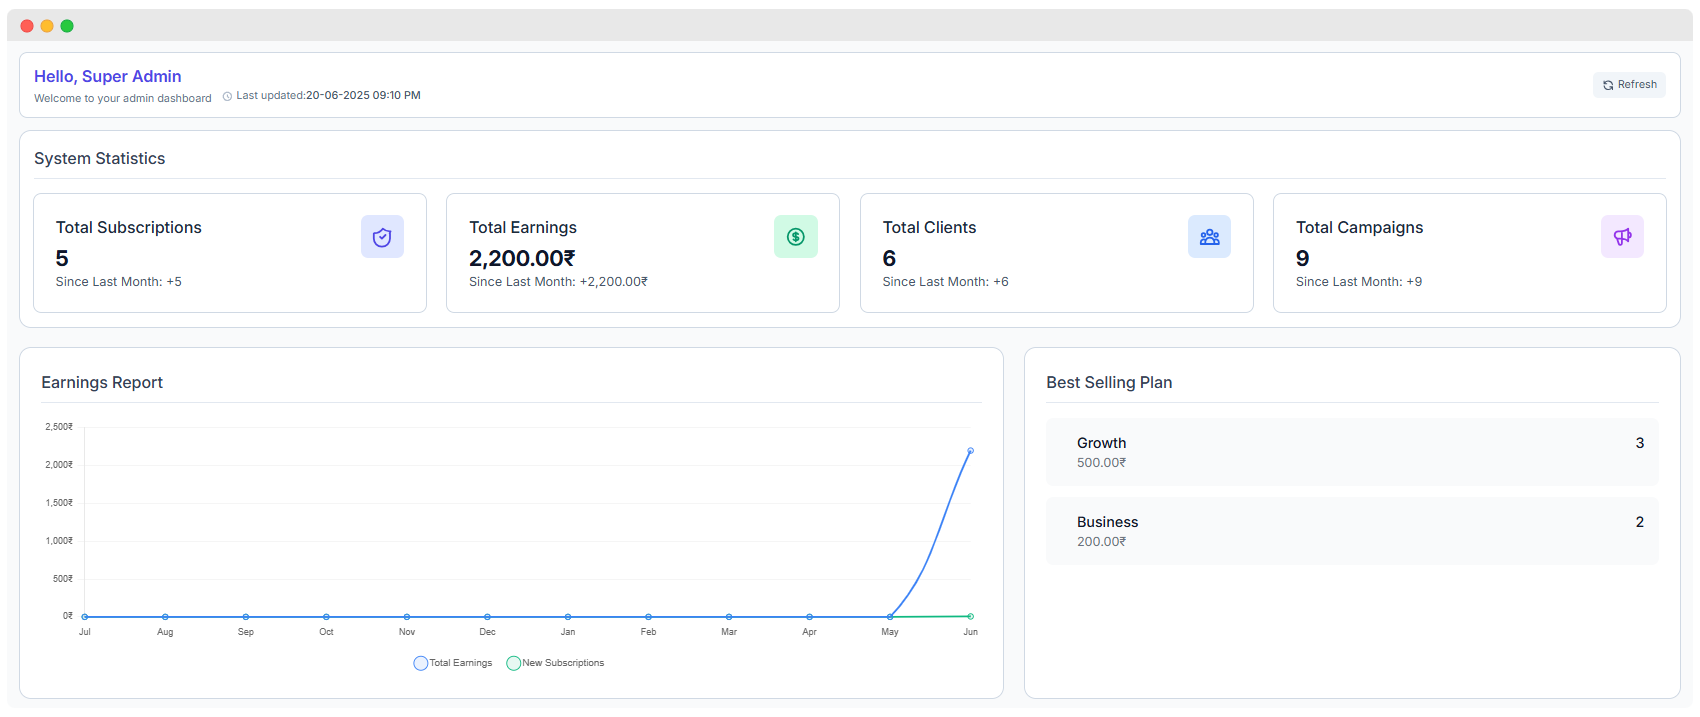
Dashboard Widgets
The admin dashboard is built with widgets — modular data panels you can show or hide individually. Each widget displays a specific slice of your platform's performance. Widget visibility is saved per user, so your changes don't affect other admins.

There are 3 widgets on the admin dashboard:
| Widget | What it shows |
|---|---|
| System Statistics | Four summary cards — Total Subscriptions, Earnings, Clients, Campaigns |
| Earnings Report | Line chart of revenue and new subscriptions over the past 12 months |
| Best Selling Plans | Ranked list of top subscription plans by active subscriber count |
Dashboard Controls
At the top of the dashboard there is a widget control bar with the following tools:
| Control | Location | What it does |
|---|---|---|
| Widget Checkboxes | Top-left | Toggle individual widgets ON or OFF instantly. Preference is saved automatically. |
| Dashboard Options | Top-right (blue button) | Opens the full widget selection panel to manage all widgets at once. |
| Hide Widgets Area | Top-right link | Collapses the entire widget section for a distraction-free view. Click again to restore. |
| Reset Dashboard | Top-right link | Restores all widgets to their default visibility — useful if you accidentally hide everything. |
| Refresh | Header area | Reloads all widget data without refreshing the full page. |
TIP
If you have accidentally hidden all widgets, click Reset Dashboard at the top-right to restore defaults.
System Statistics Overview
The top section provides summary cards for key system-wide indicators. These are auto-updated based on platform usage.
Total Subscriptions
- Current Count:
5 - Monthly Growth:
+5 - Purpose: Reflects the total number of active, paying customer subscriptions across all plans.
- Insight Gained: Helps track monetization and customer conversion success.
- Use Case: Monitor marketing funnel success, churn rate, and campaign conversion efficiency.
Total Earnings
- Current Revenue:
₹2,200.00 - Monthly Growth:
+₹2,200.00 - Purpose: Displays total cumulative revenue generated by all active plans.
- Revenue Source: Subscription sales only (no one-time or manual transactions included).
- Use Case: Gauge profitability, assess monthly recurring revenue (MRR), and set revenue benchmarks.
Total Clients
- Current Count:
6 - Monthly Growth:
+6 - Definition: A "Client" refers to a tenant in the multi-tenant architecture.
- Use Case: Monitor user acquisition rate, track onboarding success, or spot growth spikes.
- Example: If you get 20 signups but only 6 complete onboarding, this reveals a funnel gap.
Total Campaigns
- Current Campaigns:
9 - Monthly Growth:
+9 - What it Measures: The total number of WhatsApp marketing campaigns created by tenants.
- Use Case: Understand platform usage intensity. High campaign creation indicates strong feature engagement.
- Insight: Growth in campaigns signals product-market fit and customer satisfaction with tools.
Earnings Report Graph
Purpose:
Visualizes your monthly revenue trend and subscription growth to identify business momentum.
Components:
- Blue Line: Total revenue earned month by month
- Green Line: Number of new subscriptions per month
Key Observations:
- Flat activity from July to April
- Revenue and subscriptions spike sharply in May–June
Admin Actions:
- Analyze spikes with marketing logs (e.g. promotional offers)
- Export to CSV for internal finance tracking
- Compare plan-level trends using filters (available in expanded reports)
Best Selling Plan Breakdown
This block displays a leaderboard of your most popular subscription packages.
Growth Plan
- Sales Count:
3 - Revenue Generated: ₹500.00 per unit → ₹1,500.00 total
- Why it's popular: May offer best balance of price-to-feature ratio
Business Plan
- Sales Count:
2 - Revenue Generated: ₹200.00 per unit → ₹400.00 total
Use Cases:
- Identify which plans drive the most revenue
- Use top plans in website CTA (Call-to-Action) sections
- Tailor onboarding and pricing messages around high-converting packages